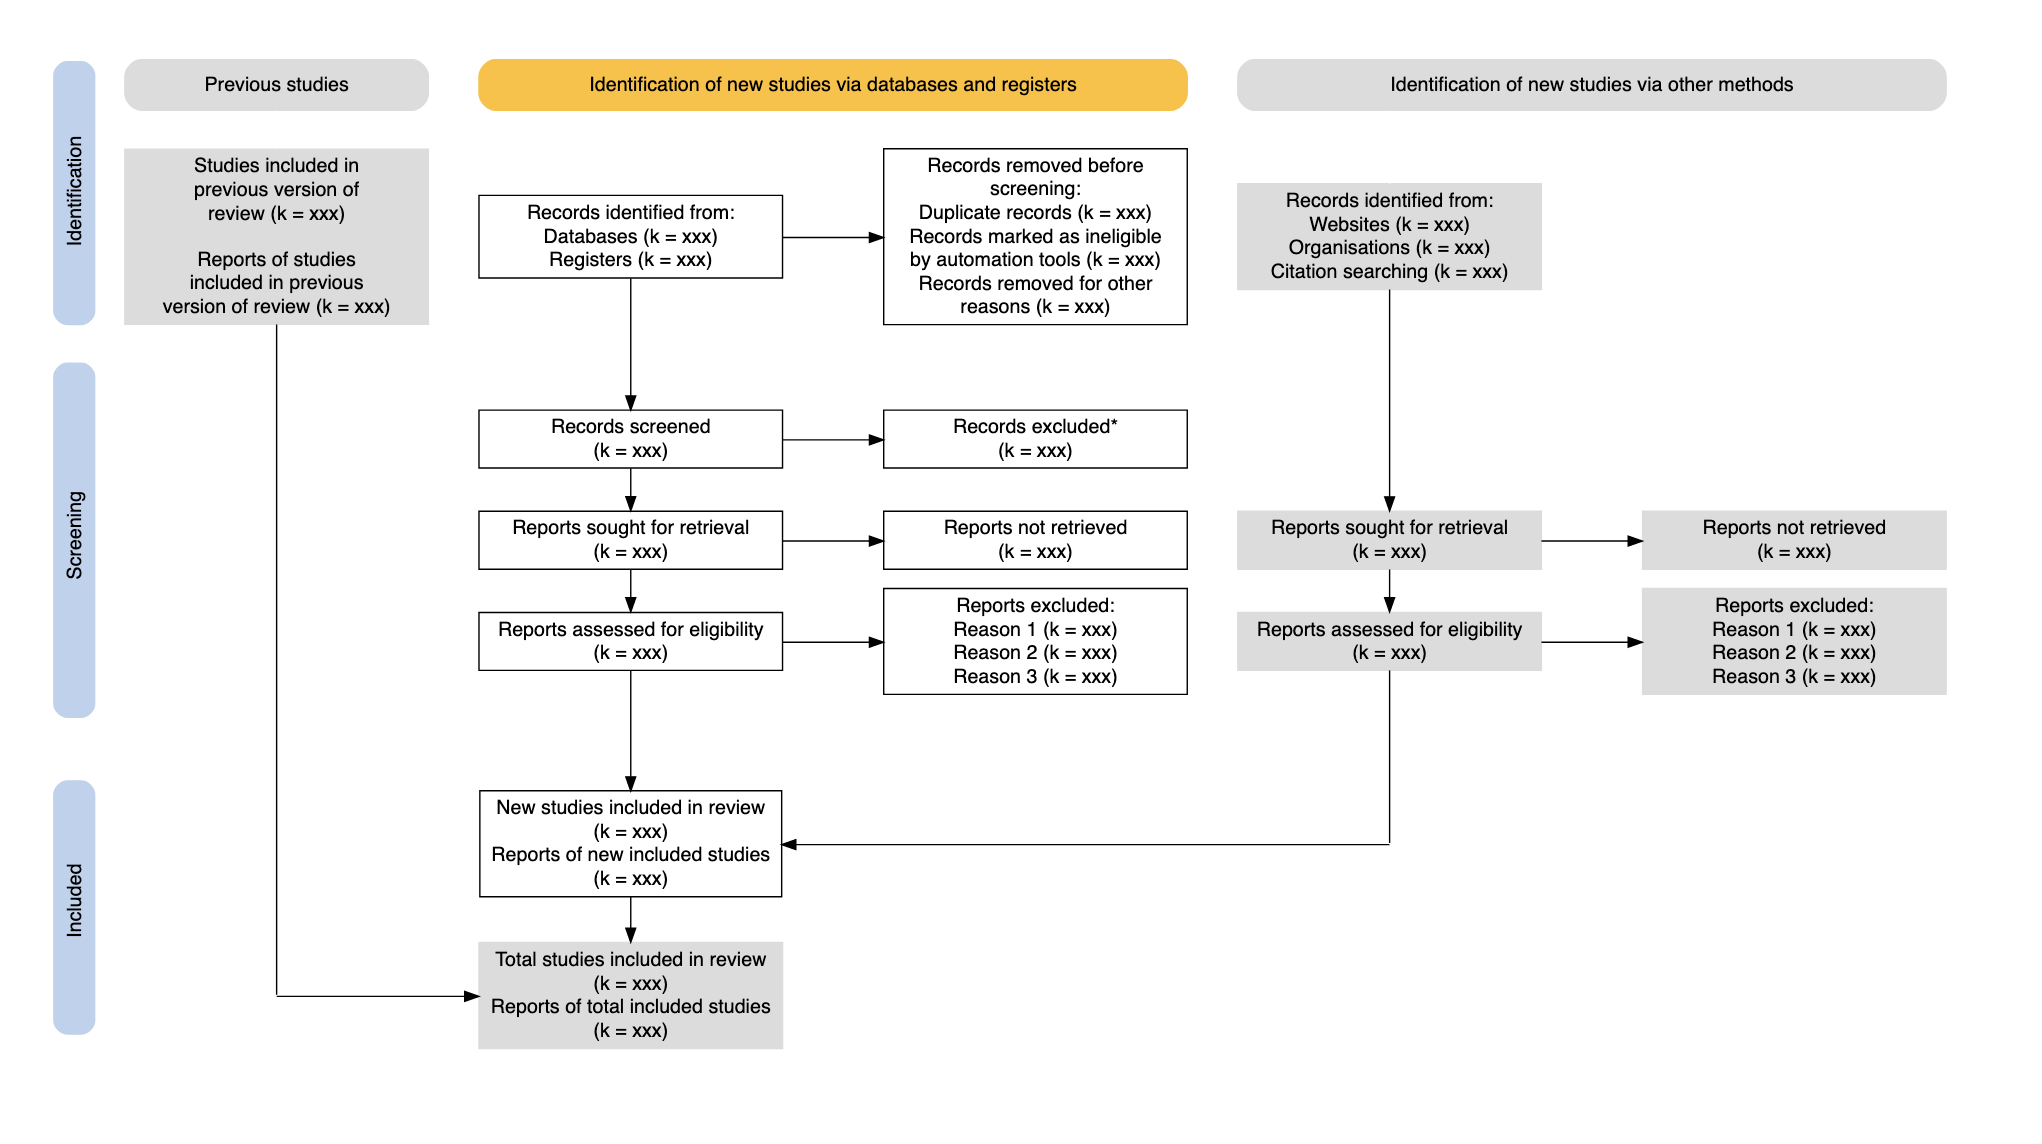
Flowcharts in evidence syntheses allow the reader to rapidly understand the core procedures used in a review and examine the attrition of irrelevant records throughout the review process. The PRISMA flow diagram published in 2009 describes the sources, numbers and fates of all identified and screened records in a review. PRISMA is currently in the final stages of a 2020 update, including a new version of the PRISMA flow diagram:

Systematic review flow diagrams undoubtedly facilitate rapid comprehension of basic review methodology. However, they have far greater potential as a tool for communication and transparency when used not only as static graphics, but also as interactive ‘site maps’ for reviews. Flow diagrams in their crudest sense consist of inputs, processes and outputs, with the ‘nodes’ (i.e. boxes) in a systematic review flow diagram containing summaries of the numbers of records included or excluded at each stage, and ‘edges’ (i.e. arrows) indicating the flow of records from sources to the final set of included studies. For each node, there is a rich set of information relating both to the methods used and the respective associated records: for example, the number of records excluded at full text eligibility screening with exclusion reasons.
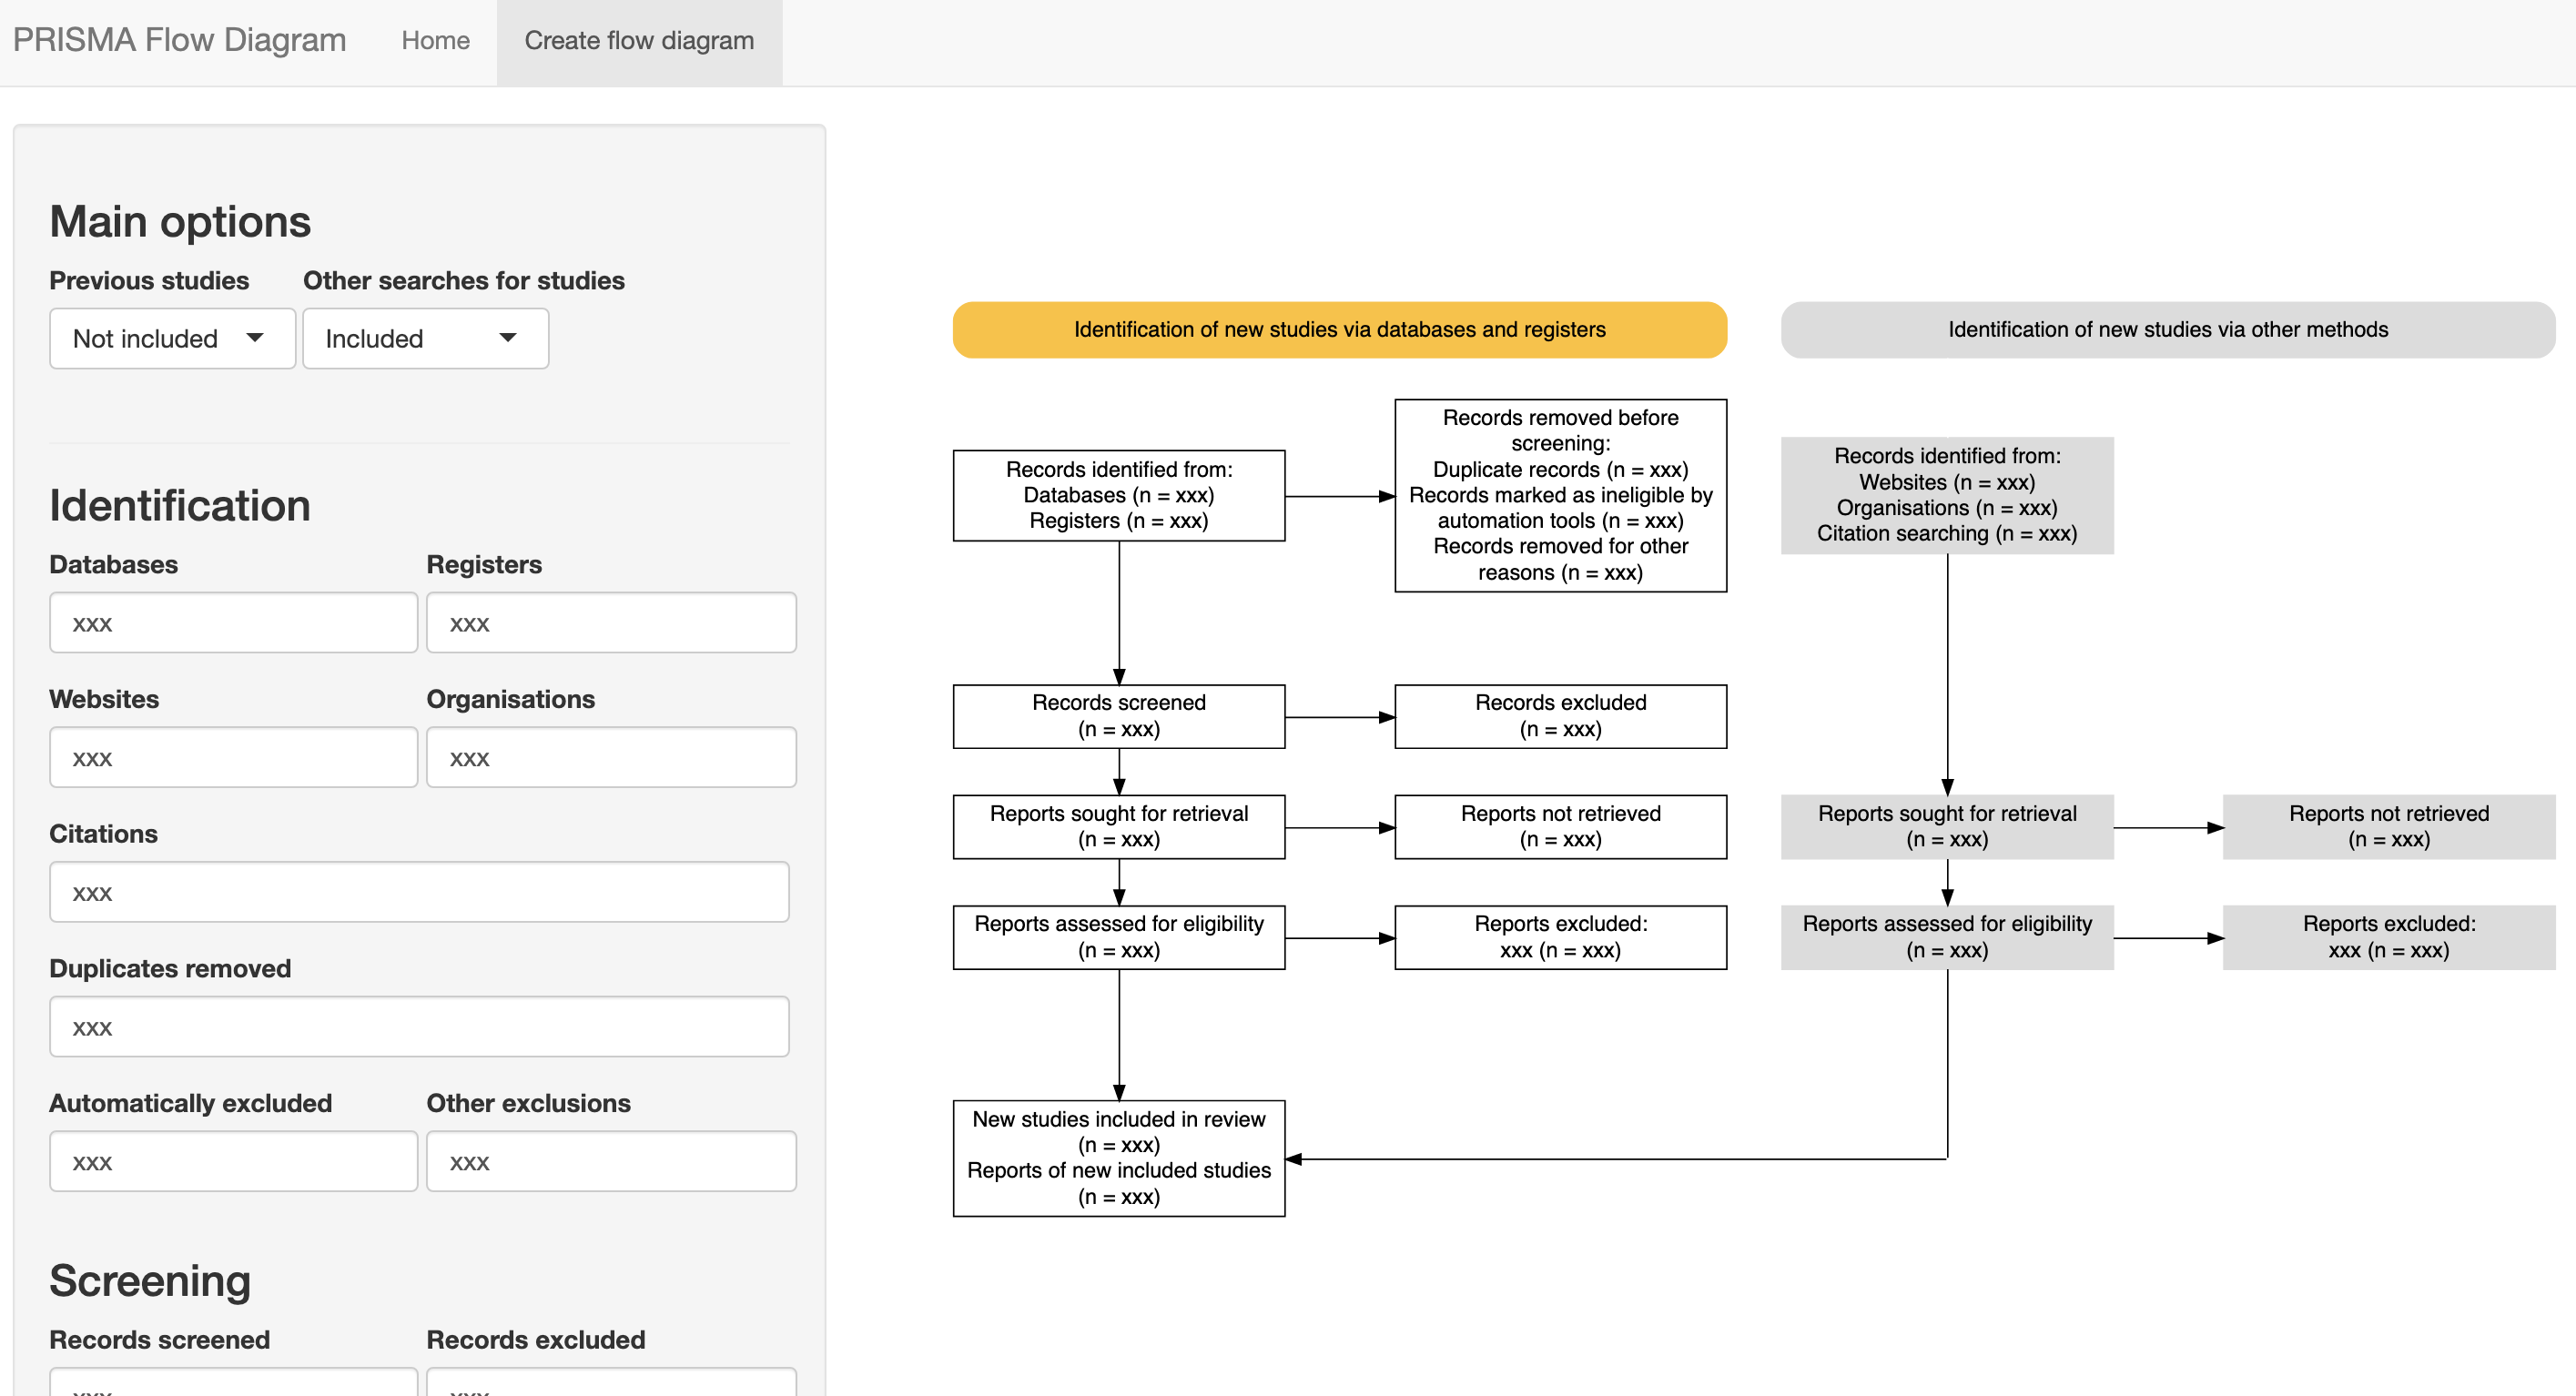
This package makes use of the DiagrammeR R package to develop a customisable flow diagram that conforms to PRISMA 2020 standards. It allows the user to specify whether previous and other study arms should be included, and allows interactivity to be embedded through the use of mouseover tooltips and hyperlinks on box clicks.
Follow this link to access the online tool

The R package has the following capabilities:
1) to allow the user to produce systematic review flow charts that conform to the latest update of the PRISMA statement (Page et al. 2020);
2) to adapt this code and publish a free-to-use, web-based tool (a Shiny App) for producing publication-quality flow chart figures without any necessary prior coding experience;
3) to allow users to produce interactive versions of the flow charts that include hyperlinks to specific web pages, files or document sections.
Read more about the package and its functionality in this paper in Campbell Systematic Reviews: https://onlinelibrary.wiley.com/doi/full/10.1002/cl2.1230


