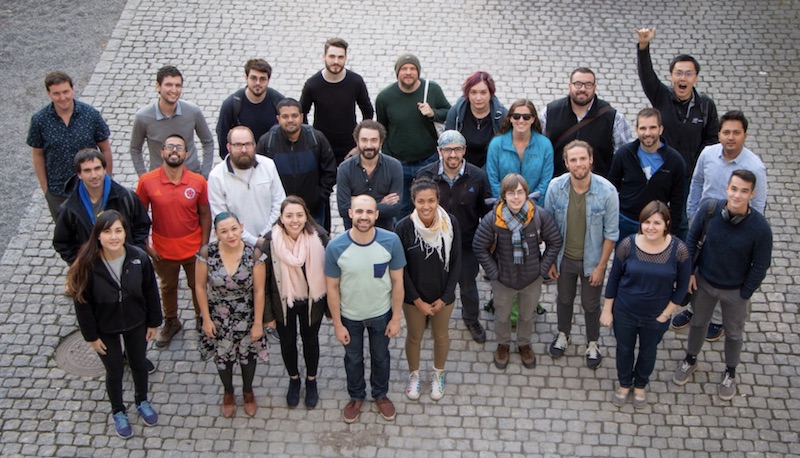
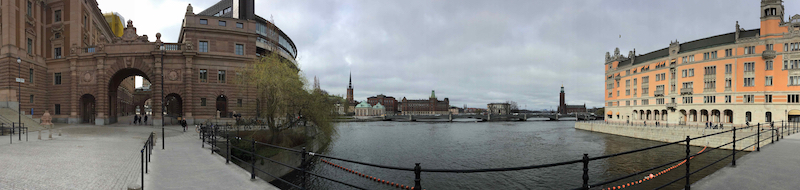
The first Evidence Synthesis Hackathon was developed by Neal Haddaway and Martin Westgate, and was held in Stockholm during April 2018. It was funded by MISTRA EviEM and the Environment and Society Synthesis Program (Fenner School, ANU). Hosted by the Stockholm Environment Institute and the Global Water Partnership, ESH2018 involved 29 participants from 10 countries.
Here you will find summaries of the outputs that our participants developed over the three days of the Evidence Synthesis Hackathon, with links to the GitHub repositories where the apps continue to be developed. Alternatively, you can read our report about the hackathon here (PDF).
Organisers


Participants


Software
This event included development of the following software projects: EviAtlas
| An R tool for systematic maps
EviAtlas
| An R tool for systematic maps
Systematic Maps are, according to the Environmental Evidence Journal, “overviews of the quantity and quality of evidence in relation to a broad (open) question of policy or management relevance.” In simple terms, this means that documents are categorized according to the type, location, and publication information available for each work within a particular topic. Systematic maps are often used for environmental research, where it is particularly important to track the location of study sites. The spatial nature of a systematic map, particularly for environmental research, means that academics often use some kind of geographic map to analyze and present their information. Understanding the academic community’s familiarity with the R programming language, we built a webapp using R Shiny that could automate certain parts of creating a systematic map for environmental research.
 metafor automated reports
| A function to summarize meta-analysis outputs
metafor automated reports
| A function to summarize meta-analysis outputs
This function dynamically generates an analysis report (in html, pdf, or docx format) based on a model object. The report includes information about the model that was fitted, the distribution of the observed outcomes, the estimate of the average outcome based on the fitted model, tests and statistics that are informative about potential (residual) heterogeneity in the outcomes, checks for outliers and/or influential studies, and tests for funnel plot asymmetry. A forest plot and a funnel plot are also provided. References for all methods/analysis steps are also added to the report and cited appropriately. Additional functionality for reports based on meta-regression models will be incorporated soon. The function is part of the metafor package.
 Paperweight
| Using natural language processing to improve search queries
Paperweight
| Using natural language processing to improve search queries
Paperweight, driven by a combination of natural language processing (NLP) algorithms. In the evidence synthesis process, the first steps typically require reviewers to manually build a database of articles and journals they want to summarize. This process entails an exhaustive search of Google Scholar using manually chosen keywords. This approach is vulnerable to bias since the reviewer might be more likely to find certain articles or journals in their review over other ones, depending on the selected search keywords. Tackling this problem, Paperweight seeks to remove the need for a reviewer to manually choose keywords to form their search queries.
 PDF annotation
| Coding and extracting data from PDFs
PDF annotation
| Coding and extracting data from PDFs
Extraction of content from articles, also known as coding, is an important part of evidence synthesis, especially for meta-analysis that require coding of multiple predefined parameters that are to be extracted from articles. This task is usually tedious therefore multiple people, potentially including external helpers may involve in coding. Software tools that assist efficient content extraction and also enable indexing of extracted context against the field labels, are highly desirable.
 PDF reference extraction
| Extract reference lists from PDFs
PDF reference extraction
| Extract reference lists from PDFs
Full-text PDFs are almost always the most reliable source of information from academic articles. Even though several resources allow for the extraction of data from full-text documents, most of the time the information is incomplete, inaccurate, or not available. PDFs were created to look great, not to extract data from. So, when you try to copy/paste from PDF you often get unexpected results. In this first version the project allows users to easily copy text from a PDF and attempts to automatically identify the references.
 Reference completer
| A tool to fill in missing information from incomplete references
Reference completer
| A tool to fill in missing information from incomplete references
Citations downloaded from bibliographic databases and other resources, such as Google Scholar, are often missing certain details like abstracts or volume/page details that are important for a variety of reasons, such as screening in systematic reviews or locating full text documents. This functionality is intended to be used for filling in missing information from a set of citation files, including abstracts.
 ROSES
| A website to support reporting of systematic evidence syntheses
ROSES
| A website to support reporting of systematic evidence syntheses
The ROSES forms were developed to improve the standards of evidence synthesis reporting and the transparency of the methods used for reviews and maps. The website (www.roses-reporting.com) aims to help adoption of the ROSES forms as well as improve the barrier to entry on using the ROSES forms in the least obtrusive way possible. In this project we’ve been working to improve the user experience, increasing efficiency and helping reviewers get the most out of the forms and website.
 Search Strategist
| A web tool to test and improve search strategies
Search Strategist
| A web tool to test and improve search strategies
Defining a good search strategy for systematic reviews can be a particularly challenging task. Some of the problems encountered are: when asking two people for a strategy they will get totally different outputs, the number of hits is prohibitively high, there are missing relevant references because a specific keyword was omitted, few means of validating search strategies exist, it is difficult to adapt the strategy for other databases, errors may be introduced when adapting strategies between databases, etc.
 Thallo Evidence Mapping
| A Jekyll Theme for Dataset Visualisation
Thallo Evidence Mapping
| A Jekyll Theme for Dataset Visualisation
This project provides an easy-to-use template for web visualisations of environmental evidence maps. Thalloo is a combination of map components and a Jekyll theme that enable quick, simple, and customisable deployment of a web-based tool to display evidence maps. The framework has the following features: i) Visual clustering and display of categorical data. Given a display category (e.g. crop, commodity), and a custom colour palette, points are displayed on a map. Depending on the zoom level and extent, points are clustered dynamically for best display. Any cluster can be selected to see the full metadata about the evidence points it contains; ii) Filtering. Data can be filtered by property in real time, using multiple filters within a property, and using multiple properties to filter; iii) Slicing of dimensionality. Given continuous data (e.g. publication year, time, or an effect size), the map allows real time ‘slicing’ of the dataset along one or many dimensions; iv) Abstract and funding logos. Provide attribution to your funders and partner institutions by including their logos at the top of your map view.
Discussions
Limitations and biases of commercial bibliographic databases | Proposed academic paper
Reliable evidence synthesis requires access to a comprehensive, unbiased body of literature that can be searched for relevant information. Systematic reviewers typically search multiple (upwards of 10) bibliographic databases to identify sets of search results that might yield relevant results. Access to these databases is often restrictively expensive, hampering efforts to synthesise evidence by smaller organisations and groups from low- and middle- income countries, for example. When reviewers export references from these databases they must typically do so in small batches (this supposedly stops people from replicating commercial databases for profit): for Web of Science this must be done in batches of 500, which can add considerable time to a review with 20,000 search results or more! Finally, databases such as Web of Science exacerbate publication bias by selecting journals and publishers that are perceived to be of ‘high impact’, for example using citation indices. So, these resources may be expensive, hard to use, and offer a biased selection of evidence. In order to facilitate evidence synthesis and to reduce bias in how information is indexed and found, we call for the production of an Open Source, Open Access on-stop-shop database that catalogues all known academic research. Since tables of contents are freely available online, technology exists that can produce such an important and useful tool.
R for Evidence Synthesis | Proposed academic paper
R is a widely-used, open source programming language and statistical environment. Users are able to contribute add-ons to R functionality in a standardised way by developing new software ‘packages’. However, identifying which packages are most useful for a specific task can be challenging, particularly for evidence synthesis (ES) projects which typically include a number of discrete tasks, many using packages that may have been designed for other purposes. Consequently, a valuable tool for future researchers (and hackathons) would be a ‘map’ of available software packages, showing how those packages apply to ES. This would help guide new users through effective workflows, as well as identifying parts of the evidence synthesis process that are currently well supported in R, or conversely, in need of further software development. This project is currently in the data collection phase, wherein participants systematically search for R packages of potential value to ES projects and catalogue their findings in a structured way. The intended output is an academic article describing our findings, linked to a live database of R packages, the functions they contain, and the specific ES tasks that they each solve.