Introducing EviAtlas
In discussion with the EviAtlas team
The EviAtlas Team:
- Neal Haddaway | Senior Research Fellow at the Stockholm Environment Institute and Research Associate at the Africa Centre for Evidence
- Andrew Feierman | Data Scientist at the Stockholm Environment Institute
- Matthew J Grainger | Postdoctoral Researcher at the Norwegian Institute for Nature Research
- Charles Gray | PhD student at LaTrobe University
- Ezgi Tanriver-Ayder | PhD student at the University of Edinburgh
- Sanita Dhaubanjar | Research Officer at the International Water Management Institute
- Martin Westgate | Research Fellow at the Australian National University
Neal, can you tell us a bit about EviAtlas – what does it do and how did it come about?
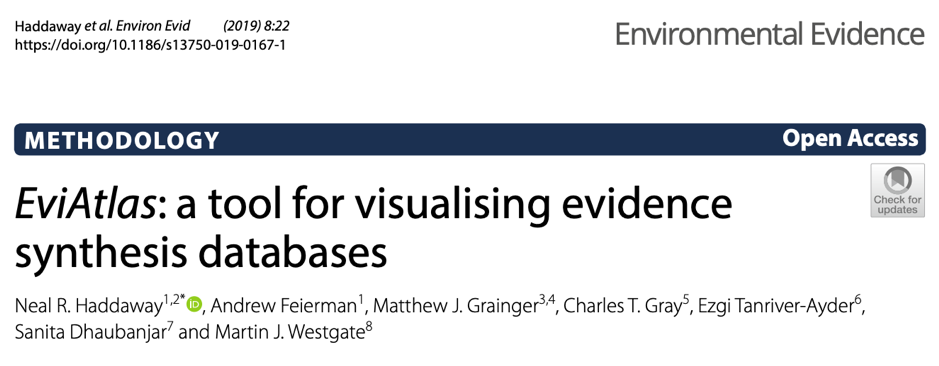
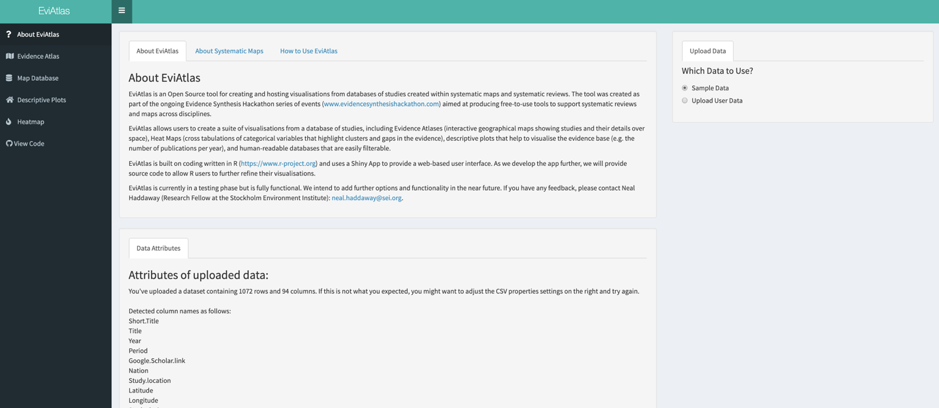
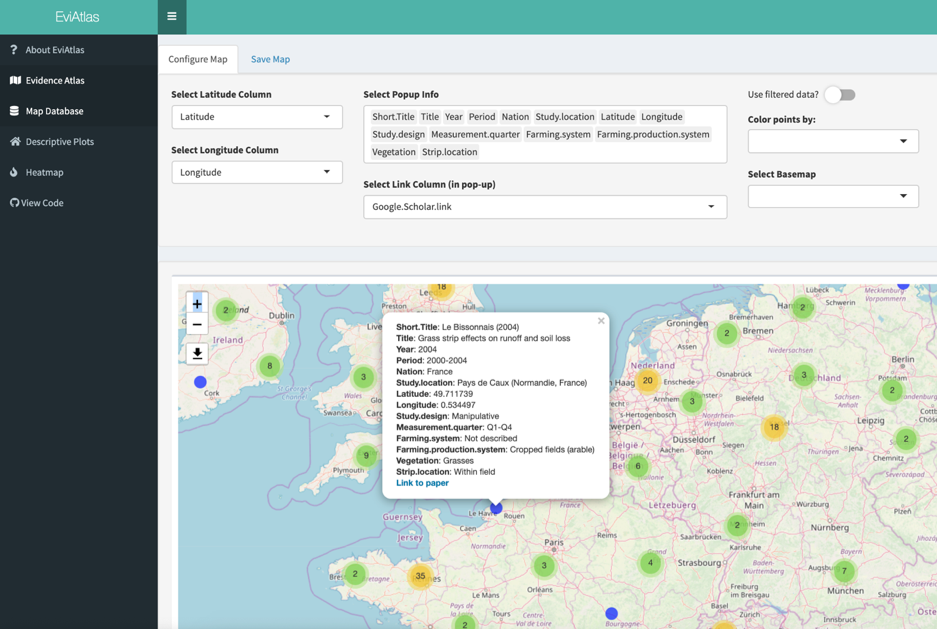
EviAtlas is a tool for visualising the evidence found within a systematic review or systematic map. Essentially, it helps you to see who did what, where, when and how! It gives a really quick overview of the nature of an evidence base without needing to ‘wrangle’ the data into specific tables and figures manually in a spreadsheet.
EviAtlas was thought up by a diverse group of programmers and evidence synthesis experts at the first Evidence Synthesis Hackathon, and it has been developed over the last 12 months to become the beautiful tool you can use today! The work has all been voluntary and thoroughly enjoyable!
Andrew, you have a background in visualisation, analytics and management of data – what got you interested in the idea of a tool like EviAtlas?
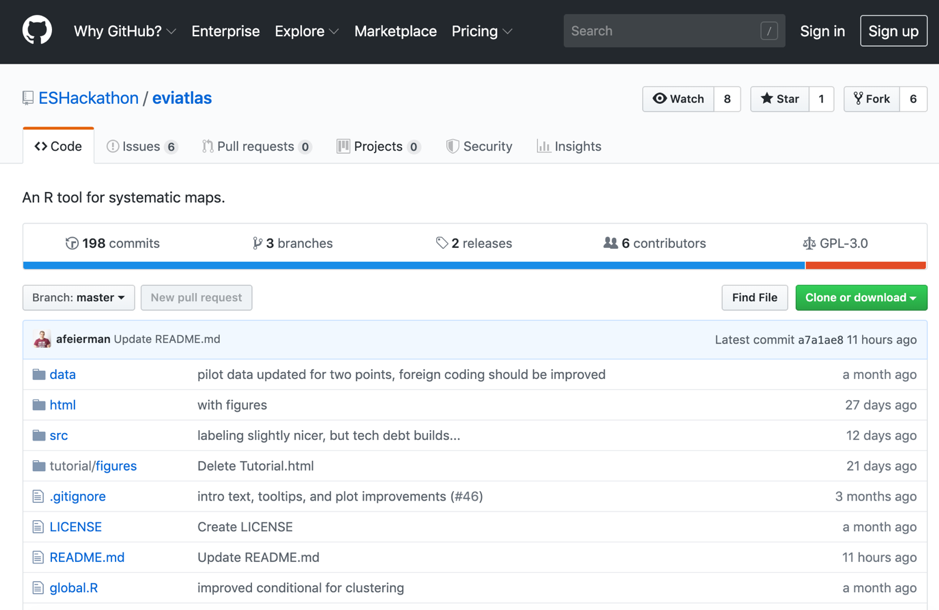
When we first came up with an outline for the app at the ES Hackathon in Stockholm, the vision that emerged seemed both exciting from a research perspective yet technically straightforward from a programming perspective. Having a well-defined project to work on from an early point allowed us to build a useful tool without getting bogged down by mission creep. The code that generates the maps and plots in EviAtlas is relatively simple, but by wrapping everything in the Shiny interface, we can make powerful open source tools accessible to more people.
Matthew, you’ve participated remotely in some of the hackathon events that helped to develop EviAtlas – was participating remotely a challenge?
Yes! It was definitely a challenge to participate but the whole EviAtlas team were great in making sure that remote participants were included in discussions about the direction of the project. Using tools like GitHub, Slack and Skype allowed me to feel like I was in the room with everyone. Coding tasks were divided up between the team based on our coding abilities (or lack of them in my case) and support was always there on Slack when I needed it. The worst part of being remote was missing out on the lovely snacks.
EviAtlas was built at the Evidence Synthesis Hackathon – Charles, what drew you to that kind of community?
My gateway was statistics, meta-analysis, specifically. Through attending ESH, I met the term evidence synthesis for the first time and learnt that meta-analysis is but one step in a process of what ESH2019 organiser Shinichi Nakagawa would call ‘weaving’ research together. By meeting a broader community of scientist interested in evidence synthesis, I have come to reframe the problems I am working on in my statistics PhD from a perspective of reproducibility and good enough practices in science.
Ezgi, how do you see authors of systematic reviews and evidence/systematic maps using EviAtlas?
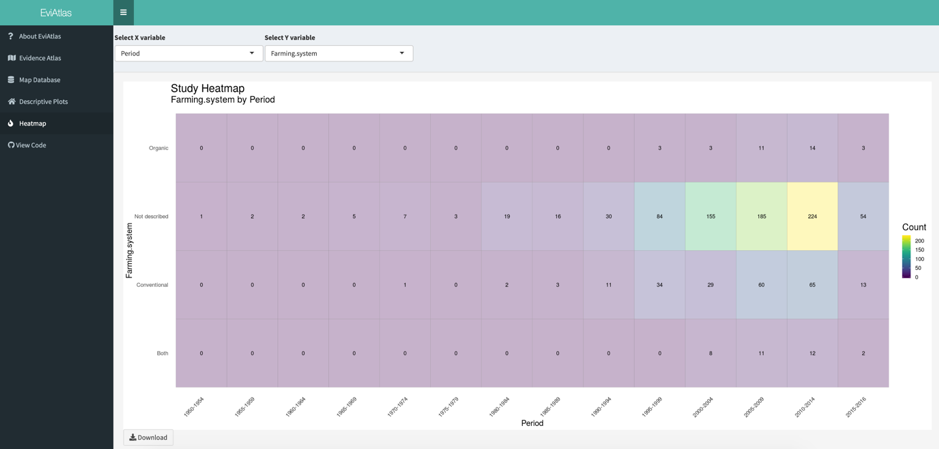
With the increasing amount of research published every day, synthesising evidence using systematic reviews and maps is becoming vital. Using EviAtlas, researchers can rapidly summarise all existing evidence via visual tools and locate gaps where further research may be needed to inform decision making. Researchers can filter and explore their data through an interactive geographical representation of spatial information and can also use heat maps and basic visualisations such as bar charts and histograms to investigate the nature, quality and extent of their current evidence. These visual tools in EviAtlas can also inform researchers on whether conducting a meta-analysis is sensible on the existent evidence.
Sanita – what was it like to collaborate on an international, interdisciplinary project like this one?
With the internet and globalization, interdisciplinary and collaborative approaches bringing together people from diverse backgrounds has never been easier. At the hackathon, our group started with people from six continents brainstorming ideas for streamlining the reporting process for systematic reviews. Because we were an international group, our brainstorming sessions were able to tease our problems faced by the evidence synthesis community across the globe, and by people with varying comfort levels with software and programs. As a programmer with very limited background in evidence synthesis, being part of EviAtlas development helped me not only learn about evidence synthesis but also become an advocate promoting evidence synthesis in Nepal and South Asia in general. Personally, the diversity among us made my ESH experience so much richer, I got to learn so much from my teammates beyond just developing R packages and synthesis tools.
One of the interesting things about EviAtlas is that it’s Open Source – Martin, can you explain what that means and why it’s important?
The term ‘Open Source’ means that anyone can see the code that runs in the background of a piece of software. Obviously, that’s not interesting to everyone; most people just want to use a piece of software, and don’t care much how it works! But I think open source is important for two key reasons.
First, open-source has the potential to be self-correcting; If anyone can see how a result is calculated, then any errors or quirks can be located and corrected by anyone who wants to go looking. The knowledge that someone can check your work might also make developers more careful when writing their code in the first place! Second, development of open source software doesn’t take place by single developers working in isolation; there is a huge community of practice that works together to make software easier to use and to deliver more powerful results. Because software is so fundamental to modern scientific research, open source approaches are driving huge advances in a number of fields.
Second, development of open source software doesn’t take place by single developers working in isolation; there is a huge community of practice that works together to make software easier to use and to deliver more powerful results. So just like Wikipedia became successful by crowd-sourcing facts, open-source software is growing by crowd-sourcing scientific analysis, which is a really exciting idea. And because software is so fundamental to modern scientific research, open source approaches are driving huge advances in a number of fields.
You’re a fresh face in the EviAtlas team, Laura – what do you think the future holds for EviAtlas?
We have our own vision for EviAtlas, of course, and a long list of ideas for future improvements. But one of the things I love most about EviAtlas is that it brings together people from many different disciplines – evidence synthesis experts, coders, and researchers from many different areas – and everyone has a unique vision and motivations for improving the tool. Users’ suggestions and requests guide our work; we work off a wishlist of features, prioritise edits and distribute tasks. In the coming months we hope to continue to tap into the enormous potential of a truly interdisciplinary and open source collaborative effort and catalyse ideas from users with lots of different perspectives. We encourage requests and ideas from both users and coders, so the future of EviAtlas really depends on the type of input that we get. So far feedback has been promising and we are looking forward to making EviAtlas more and more useful!
